Pythonによる信号処理のGUIアプリ作成挑戦記第4弾は「スペクトログラム編」です。平均化フーリエ変換ができるとすぐ実装可能なSTFT計算を復習しながら、どうやってGUIプログラミングに組み込んでいくか、特有の例外処理も含めて紹介します。
こんにちは。wat(@watlablog)です。ここでは信号処理分野でとりあえず見ておこうというくらいポピュラーなスペクトログラム表示をGUIで書きます!
バックナンバー
この記事は以下の記事の内容を前提とした続きものです。
是非こちらの記事も読んでみてください。
①アプリ構想とフレーム構築編
「フレーム構築編:wxPythonで信号処理のGUIアプリをつくろう①」の記事で信号処理のGUIアプリを作り始めました。
この記事はどんなコンセプトでアプリを作るのか、各GUIをどうやって作っていくのか、開発環境や実際に作ったGUIコードを紹介しています。
②波形読み込み編
「波形読み込み編:wxPythonで信号処理のGUIアプリをつくろう②」の記事ではファイル読み込み部分を実装しました。ボタンによるファイル選択、拡張子制限、matplotlibへのデータ渡しといったコードを紹介しています。
③周波数波形編
「周波数波形編:wxPythonで信号処理のGUIアプリをつくろう③」の記事は平均化フーリエ変換を扱いました。平均化フーリエ変換はフレームサイズの条件次第で計算がかからない(オーバーラップ処理ができない)ため、関連の例外処理を施す必要がありました。
この辺りからGUIプログラミングは例外処理がなんとも面倒に感じる部分だと思います。
この記事でやること
STFT計算
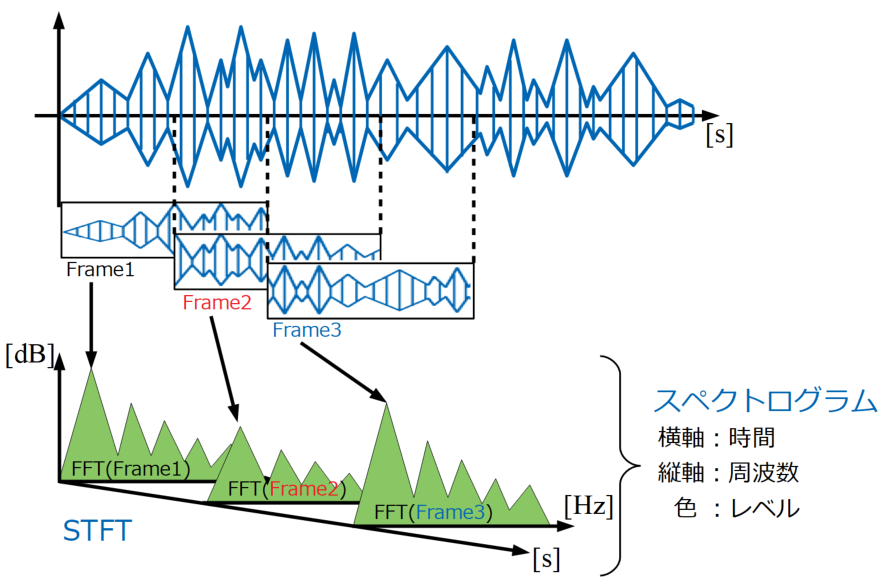
スペクトログラム表示はSTFT(Short-Time Fourier Transform)という計算を行います。
STFT計算についての詳細や、自作のPythonコードは「Pythonで音のSTFT計算を自作!スペクトログラム表示する方法」という記事で紹介していますので、是非中身を知りたい方はこちらの記事をご覧ください。
スペクトログラムの記事と前回の記事をお読みいただくと気付くと思いますが、STFT計算は平均化フーリエ変換を行う処理をほぼ流用しています(最後に平均化しないで2Dマップとして扱うところが差異)。
↓STFT計算のイメージはこちら。

つまりこれまでの記事でdspToolkit.pyに実装したcalc_overlap()やfft()といったメソッドをそのまま(一部追加)使うことが可能です。
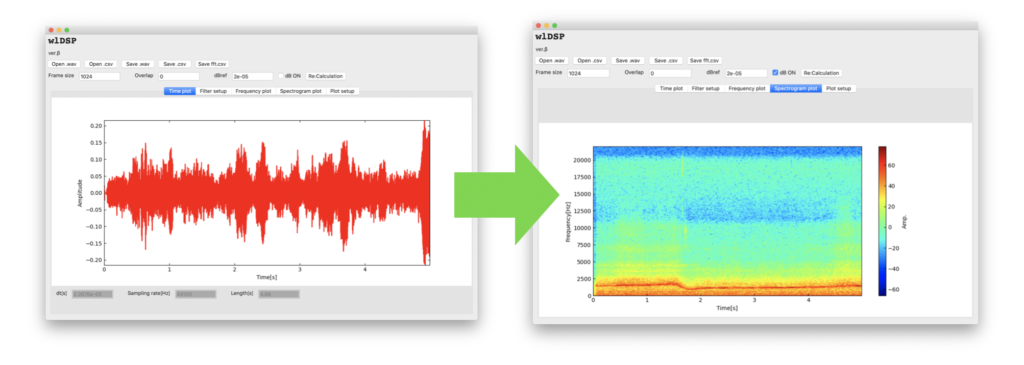
下図がGUI上でスペクトログラム表示を実装するイメージ図です。
時間波形を読み込んだタイミングで、設定に基づき計算を行うというものです。

matplotlibをwxPythonで扱うので表示がおかしくならないように自分でコーディングする必要があります(何も考えないとカラーバー無限増殖、プロットが段々小さくなる…といった症状が出ます!)。
それでは早速コードの紹介をしていきましょう!
スペクトログラム表示をGUIで行うPythonコード
dspToolkit.py
def calc_overlap()
最後にdspToolkit.pyに記載した全コードを示していますが、今回のスペクトログラム表示機能実装のためにはcalc_overlap()を少し編集しただけです。
編集箇所はfinal_timeの計算部分です。STFTはフレーム移動をさせながら計算しますが、オーバーラップを考慮してもちょうどよくフレームで割り切れない時は端っこの計算をしません。そのためmatplotlibで正しい横軸の設定を行うためにスペクトログラム用の時間長情報を取得しているというわけです。
全コード
コピペ用の全コードはこちら。
|
1 2 3 4 5 6 7 8 9 10 11 12 13 14 15 16 17 18 19 20 21 22 23 24 25 26 27 28 29 30 31 32 33 34 35 36 37 38 39 40 41 42 43 44 45 46 47 48 49 50 51 52 53 54 55 56 57 58 59 60 61 62 63 64 65 66 67 68 69 70 71 72 73 74 75 76 77 78 79 80 81 82 83 84 85 86 87 88 89 90 |
import soundfile as sf import numpy as np import pandas as pd from scipy import fftpack from scipy import signal class DspToolkit(): def __init__(self): '''コンストラクタ''' # 時間波形読み込みで使う変数 self.time_y = np.array(0) self.time_x = np.array(0) self.sampling = 0 self.dt = 0 self.length = 0 # フーリエ変換で使う変数 self.frame_size = 1024 self.overlap = 0 self.dbref = 2e-5 self.averaging = 0 self.fft_axis = np.array(0) self.fft_mean = np.array(0) self.fft_array = np.array(0) self.acf = 0 def open_wav(self, path): '''パスを受け取ってwavファイルを読み込む''' self.time_y, self.sampling = sf.read(path) self.get_time_information() def open_csv(self, path): '''パスを受け取ってcsvファイルを読み込む''' df = pd.read_csv(path, encoding='SHIFT-JIS') self.time_y = df.T.iloc[1] self.sampling = 1 / df.T.iloc[0, 1] self.get_time_information() def get_time_information(self): '''Time plotの表示器に表示させる情報の計算と時間軸作成を行う''' self.dt = 1 / self.sampling self.time_x = np.arange(0, len(self.time_y), 1) * self.dt self.length = len(self.time_x) * self.dt print('Time waveform information was obtained.') def calc_overlap(self): '''時間波形をオーバーラップ率で切り出してリスト化する''' frame_cycle = self.frame_size / self.sampling x_ol = self.frame_size * (1 - (self.overlap / 100)) self.averaging = int((self.length - (frame_cycle * (self.overlap / 100))) / (frame_cycle * (1 - (self.overlap / 100)))) time_array = [] final_time = 0 if self.averaging != 0: for i in range(self.averaging): ps = int(x_ol * i) time_array.append(self.time_y[ps:ps+self.frame_size:1]) final_time = (ps + self.frame_size) / self.sampling print('Frame size=', self.frame_size) print('Frame cycle=', frame_cycle) print('averaging=', self.averaging) return time_array, final_time return time_array, final_time def hanning(self, time_array): '''ハニング窓をかけ振幅補正係数ACFを計算する''' han = signal.hann(self.frame_size) self.acf = 1 / (sum(han) / self.frame_size) # オーバーラップされた複数時間波形全てに窓関数をかける for i in range(self.averaging): time_array[i] = time_array[i] * han return time_array def fft(self, time_array): '''平均化フーリエ変換をする''' fft_array = [] for i in range(self.averaging): # FFTをして配列に追加、窓関数補正値をかけ、(Fs/2)の正規化を実施。 fft_array.append(self.acf * np.abs(fftpack.fft(np.array(time_array[i])) / (self.frame_size / 2))) # 全てのFFT波形のパワー平均を計算してから振幅値とする。 self.fft_axis = np.linspace(0, self.sampling, self.frame_size) self.fft_array = np.array(fft_array) self.fft_mean = np.sqrt(np.mean(self.fft_array ** 2, axis=0)) def db(self, x, dBref): '''dB変換をする''' y = 20 * np.log10(x / dBref) return y |
wlFrontPanel.py
def clear_spec_plot(self):
このメソッドはスペクトログラムのプロットをクリアするためのものです。GUI操作中にエラーが発生する等の例外処理時に多用します。
プロットをクリアしないとデータ解析していないのに前の情報が残ってしまうことになるので、ユーザーが誤った判断をしてしまう可能性があります。
これまで書いたclear_freq_plot()のある場所に追記しておきます。
def spectrogram_plot(self, fft_array, final_time):
ここで実際のスペクトログラム表示をします。主にmatplotlibによる表示を行っています。
一度remove()を行ってからプロットするにはこれまでの波形と同様です(カラーバーもcbar.remove()しています)。
このメソッドはフーリエ変換をする時と同じタイミングで使うので、def freq_data_plot(self):の中で呼びだすようにしました。
全コード
全コードはこちら。今回は編集箇所が少ないように思いました。
|
1 2 3 4 5 6 7 8 9 10 11 12 13 14 15 16 17 18 19 20 21 22 23 24 25 26 27 28 29 30 31 32 33 34 35 36 37 38 39 40 41 42 43 44 45 46 47 48 49 50 51 52 53 54 55 56 57 58 59 60 61 62 63 64 65 66 67 68 69 70 71 72 73 74 75 76 77 78 79 80 81 82 83 84 85 86 87 88 89 90 91 92 93 94 95 96 97 98 99 100 101 102 103 104 105 106 107 108 109 110 111 112 113 114 115 116 117 118 119 120 121 122 123 124 125 126 127 128 129 130 131 132 133 134 135 136 137 138 139 140 141 142 143 144 145 146 147 148 149 150 151 152 153 154 155 156 157 158 159 160 161 162 163 164 165 166 167 168 169 170 171 172 173 174 175 176 177 178 179 180 181 182 183 184 185 186 187 188 189 190 191 192 193 194 195 196 197 198 199 200 201 202 203 204 205 206 207 208 209 210 211 212 213 214 215 216 217 218 219 220 221 222 223 224 225 226 227 228 229 230 231 232 233 234 235 236 237 238 239 240 241 242 243 244 245 246 247 248 249 250 251 252 253 254 255 256 257 258 259 260 261 262 263 264 265 266 267 268 269 270 271 272 273 274 275 276 277 278 279 280 281 282 283 284 285 286 287 288 289 290 291 292 293 294 295 296 297 298 299 300 301 302 303 304 305 306 307 308 309 310 311 312 313 314 315 316 317 318 319 320 321 322 323 324 325 326 327 328 329 330 331 332 333 334 335 336 337 338 339 340 341 342 343 344 345 346 347 |
"""Subclass of FrontPanel, which is generated by wxFormBuilder.""" import wx import numpy as np import MainFrame from dspToolkit import DspToolkit # Implementing FrontPanel class WlFrontPanel(MainFrame.FrontPanel): def __init__(self, parent): MainFrame.FrontPanel.__init__(self, parent) # 初期化 # ファイル self.input_file = '' # 信号処理クラスのインスタンス化 self.dsp = DspToolkit() # ファイルダイアログの戻り値定数(条件分岐用) self.FLAG_OPEN = 5100 self.FLAG_CANCEL = 5101 self.FLAG_YES = 5103 self.FLAG_NO = 5104 # GUI表示器に初期値を格納 self.textCtrl_FrameSize.SetValue(str(self.dsp.frame_size)) self.textCtrl_Overlap.SetValue(str(self.dsp.overlap)) self.textCtrl_dBref.SetValue(str(self.dsp.dbref)) def file_selector(self, message, extension): '''指定した拡張子のファイルパスをダイアログで取得する''' # ダイアログでファイルオープン open_dialog = wx.FileDialog(None, message, wildcard=extension) # FLAG_OPEN=5100, FLAG_CANCEL=5101 file_ans = open_dialog.ShowModal() if file_ans == self.FLAG_OPEN: print('User selected file open operation.') self.input_file = open_dialog.GetPath() print('Selected path is;', self.input_file) return self.FLAG_OPEN else: print('User canceled file open operation.') return self.FLAG_CANCEL def time_data_plot(self, time_x, time_y, length): '''時間波形をプロットしてタブをTime plot(0)に切り替える''' time_data = self.ax1_time.plot(time_x, time_y, color='red') # オートスケールで軸設定する場合 self.ax1_time.set_xlim(0, length) self.ax1_time.set_ylim(np.min(time_y), np.max(time_y)) self.canvas_timeplot.draw() line_time = time_data.pop(0) line_time.remove() # タブ(wx.Notebook)の切り替え self.Tab.SetSelection(0) def clear_freq_plot(self): '''周波数波形プロットと平均化回数情報をクリアにする''' fft_data = self.ax1_fft.plot(0, 0) self.canvas_fftplot.draw() line_fft = fft_data.pop(0) line_fft.remove() self.textCtrl_Average.SetValue('0') def clear_spec_plot(self): '''スペクトログラム表示をクリアにする''' self.cbar.remove() self.im.remove() self.ax1_spec.set_ylim(0, 10) self.im = self.ax1_spec.imshow(np.zeros((10, 10)), vmin=-1, vmax=1, aspect='auto', cmap='jet') self.cbar = self.fig_spec.colorbar(self.im) self.canvas_specplot.draw() def freq_data_plot(self): '''読み込んだ時間波形に対しフーリエ変換をかけて周波数プロットする''' try: int(self.textCtrl_FrameSize.Value) int(self.textCtrl_Overlap.Value) float(self.textCtrl_dBref.Value) except ValueError: # 設定値が計算に使えない値の時はエラーメッセージを表示し、周波数プロット/スペクトログラムクリアと表示器の初期化をする。 message = 'Frequency calculation was ignored. Unusable value(s) were entered into frequency calculation setting.' code = (1, message) print(code) self.clear_freq_plot() self.clear_spec_plot() return # 時間波形をオーバーラップ処理する。 time_array, final_time = self.dsp.calc_overlap() # オーバーラップ処理した波形リストに窓間数をかける。 time_array = self.dsp.hanning(time_array) # オーバーラップができない場合は処理を終わらせる。 if time_array == []: message = 'Overlap calculation was ignored. Frame size was larger than data length.' code = 1, message print(code) self.clear_freq_plot() self.clear_spec_plot() return # 平均化フーリエ変化をする。 self.dsp.fft(time_array) # 周波数波形にプロットする。 if self.checkBox_dBswitch.Value == True: # dBrefチェックボックスがONの時は振幅をdB変換する。 self.dsp.fft_mean = self.dsp.db(self.dsp.fft_mean, float(self.textCtrl_dBref.Value)) fft_data = self.ax1_fft.plot(self.dsp.fft_axis, self.dsp.fft_mean, color='red') # オートスケールで軸設定する場合 self.ax1_fft.set_xlim(0, self.dsp.fft_axis[int((len(self.dsp.fft_axis)-1)/2)]) # ナイキスト周波数までの表示 self.ax1_fft.set_ylim(np.min(self.dsp.fft_mean), np.max(self.dsp.fft_mean)*1.1) self.canvas_fftplot.draw() line_fft = fft_data.pop(0) line_fft.remove() # 平均化回数を表示器に入力する。 self.textCtrl_Average.SetValue(str(self.dsp.averaging)) message = 'Frequency calculation was done successfully.' code = 0, message print(code) # スペクトログラム表示 self.spectrogram_plot(self.dsp.fft_array, final_time) return def spectrogram_plot(self, fft_array, final_time): '''スペクトログラム表示をする''' # オートスケールで軸設定する場合(x軸はself.imで行う仕様) self.ax1_spec.set_ylim(0, self.dsp.fft_axis[int((len(self.dsp.fft_axis) - 1) / 2)]) # ナイキスト周波数までの表示 if self.checkBox_dBswitch.Value == True: fft_array = self.dsp.db(fft_array, self.dsp.dbref) spec_min = np.min(fft_array) spec_max = np.max(fft_array) self.cbar.remove() self.im.remove() self.im = self.ax1_spec.imshow(fft_array.T, vmin=spec_min, vmax=spec_max, extent=[0, final_time, 0, self.dsp.sampling], aspect='auto', cmap='jet') self.cbar = self.fig_spec.colorbar(self.im) self.cbar.set_label('Amp.') self.canvas_specplot.draw() # Handlers for FrontPanel events. def FrontPanelOnClose(self, event): '''ダイアログボックス選択式のウィンドウクローズ''' # Yes/Noダイアログを使ってユーザに選択させる。 message_dialog = wx.MessageDialog(None, 'Do you really want to close window?', 'Window close dialog', wx.YES_NO) ans = message_dialog.ShowModal() # FLAG_YES=5103, FLAG_NO=5104 if ans == self.FLAG_YES: print('User selected YES button to close window.') self.Destroy() def Button_open_wavOnButtonClick(self, event): '''wavファイルを開き時間波形を表示させる''' print('Open.wav was clicked.') # ファイルダイアログを開きwavファイルのパスを取得する。 ans = self.file_selector(message='Select a wav file.', extension='*.wav') # Open操作の時のみ操作を実行する。 if ans == self.FLAG_OPEN: self.dsp.open_wav(self.input_file) # 時間波形情報をTextCtrlに表示する。 self.textCtrl_dt.SetValue(str('{:.4e}'.format(self.dsp.dt))) self.textCtrl_Samplingrate.SetValue(str(self.dsp.sampling)) self.textCtrl_length.SetValue(str(np.round(self.dsp.length, 2))) # 時間波形をプロットする。 self.time_data_plot(self.dsp.time_x, self.dsp.time_y, self.dsp.length) # フーリエ変換をして周波数波形をプロットする。 self.freq_data_plot() def Button_open_csvOnButtonClick(self, event): '''csvファイルを開き時間波形を表示させる''' print('Open.csv was clicked.') # ファイルダイアログを開きwavファイルのパスを取得する。 ans = self.file_selector(message='Select a csv file.', extension='*.csv') # Open操作の時のみ操作を実行する。 if ans == self.FLAG_OPEN: self.dsp.open_csv(self.input_file) # 時間波形情報をTextCtrlに表示する。 self.textCtrl_dt.SetValue(str('{:.4e}'.format(self.dsp.dt))) self.textCtrl_Samplingrate.SetValue(str(self.dsp.sampling)) self.textCtrl_length.SetValue(str(np.round(self.dsp.length, 2))) # 時間波形をプロットする。 self.time_data_plot(self.dsp.time_x, self.dsp.time_y, self.dsp.length) # フーリエ変換をして周波数波形をプロットする。 self.freq_data_plot() def Button_save_wavOnButtonClick(self, event): # TODO: Implement Button_save_wavOnButtonClick pass def Button_save_csvOnButtonClick(self, event): # TODO: Implement Button_save_csvOnButtonClick pass def Button_Save_fft_csvOnButtonClick(self, event): # TODO: Implement Button_Save_fft_csvOnButtonClick pass def textCtrl_FrameSizeOnText(self, event): print('Set frame size.') try: self.dsp.frame_size = int(self.textCtrl_FrameSize.Value) except ValueError: pass def textCtrl_OverlapOnText(self, event): print('Set overlap ratio.') try: self.dsp.overlap = int(self.textCtrl_Overlap.Value) except ValueError: pass def textCtrl_dBrefOnText(self, event): print('Set dB-reference.') try: self.dsp.dbref = float(self.textCtrl_dBref.Value) except ValueError: pass def Button_re_calcOnButtonClick(self, event): self.freq_data_plot() def Button_lpOnButtonClick(self, event): # TODO: Implement Button_lpOnButtonClick pass def textCtrl_lp_freqOnText(self, event): # TODO: Implement textCtrl_lp_freqOnText pass def Button_hpOnButtonClick(self, event): # TODO: Implement Button_hpOnButtonClick pass def textCtrl_hp_freqOnText(self, event): # TODO: Implement textCtrl_hp_freqOnText pass def textCtrl_attenuation_passOnText(self, event): # TODO: Implement textCtrl_attenuation_passOnText pass def textCtrl_attenuation_stopOnText(self, event): # TODO: Implement textCtrl_attenuation_stopOnText pass def Button_bpOnButtonClick(self, event): # TODO: Implement Button_bpOnButtonClick pass def textCtrl_bp_freq_lowOnText(self, event): # TODO: Implement textCtrl_bp_freq_lowOnText pass def textCtrl_bp_freq_highOnText(self, event): # TODO: Implement textCtrl_bp_freq_highOnText pass def Button_bsOnButtonClick(self, event): # TODO: Implement Button_bsOnButtonClick pass def textCtrl_bs_freq_lowOnText(self, event): # TODO: Implement textCtrl_bs_freq_lowOnText pass def textCtrl_bs_freq_highOnText(self, event): # TODO: Implement textCtrl_bs_freq_highOnText pass def Button_original_dataOnButtonClick(self, event): # TODO: Implement Button_original_dataOnButtonClick pass def checkbox_time_fixOnCheckBox(self, event): # TODO: Implement checkbox_time_fixOnCheckBox pass def textCtrl_time_xminOnText(self, event): # TODO: Implement textCtrl_time_xminOnText pass def textCtrl_time_xmaxOnText(self, event): # TODO: Implement textCtrl_time_xmaxOnText pass def textCtrl_time_yminOnText(self, event): # TODO: Implement textCtrl_time_yminOnText pass def textCtrl_ymaxOnText(self, event): # TODO: Implement textCtrl_ymaxOnText pass def checkbox_freq_fixOnCheckBox(self, event): # TODO: Implement checkbox_freq_fixOnCheckBox pass def textCtrl_freq_xminOnText(self, event): # TODO: Implement textCtrl_freq_xminOnText pass def textCtrl_freq_xmaxOnText(self, event): # TODO: Implement textCtrl_freq_xmaxOnText pass def textCtrl_freq_yminOnText(self, event): # TODO: Implement textCtrl_freq_yminOnText pass def textCtrl_freq_ymaxOnText(self, event): # TODO: Implement textCtrl_freq_ymaxOnText pass |
スペクトログラム表示動作のデモ
YouTube動画による動作確認結果
動作確認はやはり動画が良いということで、いつも通りYouTubeに動画を投稿してみました。
今回は時間波形やcsv波形を読み込んだ時のスペクトグラム表示の挙動を確認しています。フレームサイズのミスマッチ等で計算ができない場合のクリア動作もありますので、是非動画で確認してみてください。
結構サクサク動いてよきですね。
まとめ
今回は平均化フーリエ変換部分のコードをちょっと拝借してスペクトログラム表示機能を実装しました。
多くの例外処理はフーリエ変換と共通しているため、今回はそんなに作業量がなかったと思います。
簡単に実装できましたが、信号のスペクトログラムから得られる情報はかなり多いと思っていますので、GUIでサクサクとファイルを切り替える機能ができたことで便利なアプリになりそうです。
次回はいよいよフィルタリングです。細々とした設定値をやりくりすることになると想定しますが、お楽しみに。
(筆者が途中で挫折しなければ…)
一つずつ機能実装ができてきました!
Twitterでも関連情報をつぶやいているので、wat(@watlablog)のフォローお待ちしています!

 ついにWATLABブログから書籍「いきなりプログラミングPython」が発売しました!