
Pythonコーディングのスキルアップのために、アルゴリズムの学習をしようと思います。ここでは探索アルゴリズムの基礎である二分探索をPythonコードで実装し、線形探索と比較してみました。
こんにちは。wat(@watlablog)です。ここでは探索アルゴリズムの1つ、二分探索をコーディングし、線形探索と比較してみます!
線形探索と二分探索の概要
探索とは?
探索(Search)とは、ある集合から目的の要素を探すことです。
例えば、「Search」という単語を辞書から探す問題を解くのも探索問題です。
辞書の1ページ目から「Search」を探していくことも可能ですが、辞書はアルファベット順にソートされているのでSの欄から見始めた方がはやく見つかりそうです。このように、よく考えると効率良く問題を解決できそうな場合はアルゴリズムが威力を発揮します。
前者のように最初から順番に探索してく方法を線形探索(Linear Search)と呼びますが、今回紹介する探索アルゴリズムは二分探索(Binary Search)と呼ばれるアルゴリズムです。単に英語のままバイナリサーチと呼ばれることもあります。
探索アルゴリズムの目標
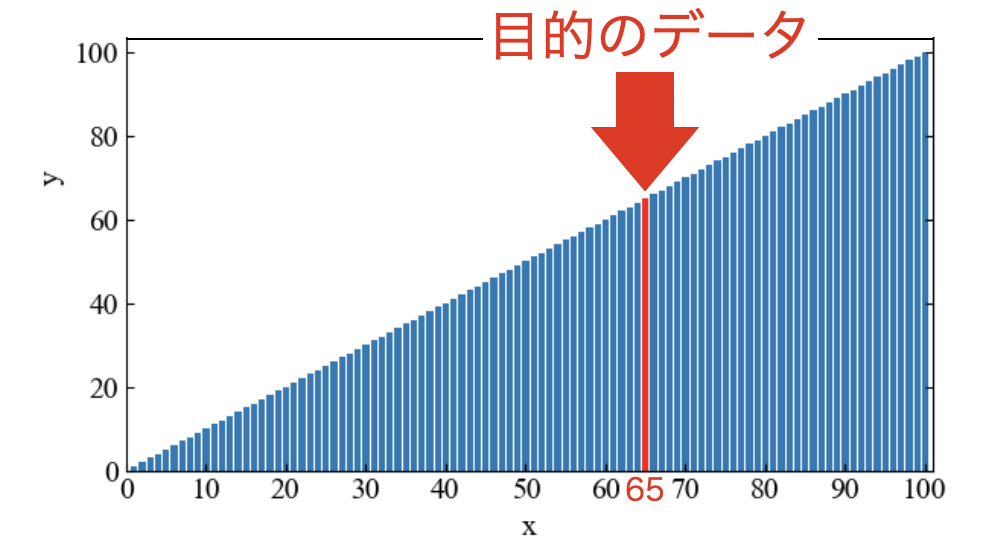
探索アルゴリズムの目標は、ずばり目的の値が全体のどこに位置しているかを特定することです。以下の図はyが0〜100までの値をとり、65というデータがどこにあるかを探索する問題の例です。
探索アルゴリズムを使うためには、事前にデータをソートしておく必要があります。ソートについては以下の記事で解説しているので、是非ご覧下さい。
「Pythonコードと図解で理解するバブルソートのアルゴリズム」
「Pythonで選択ソートのアルゴリズムを実装する方法【動画付】」
フローチャートとアニメーションによる解説
線形探索
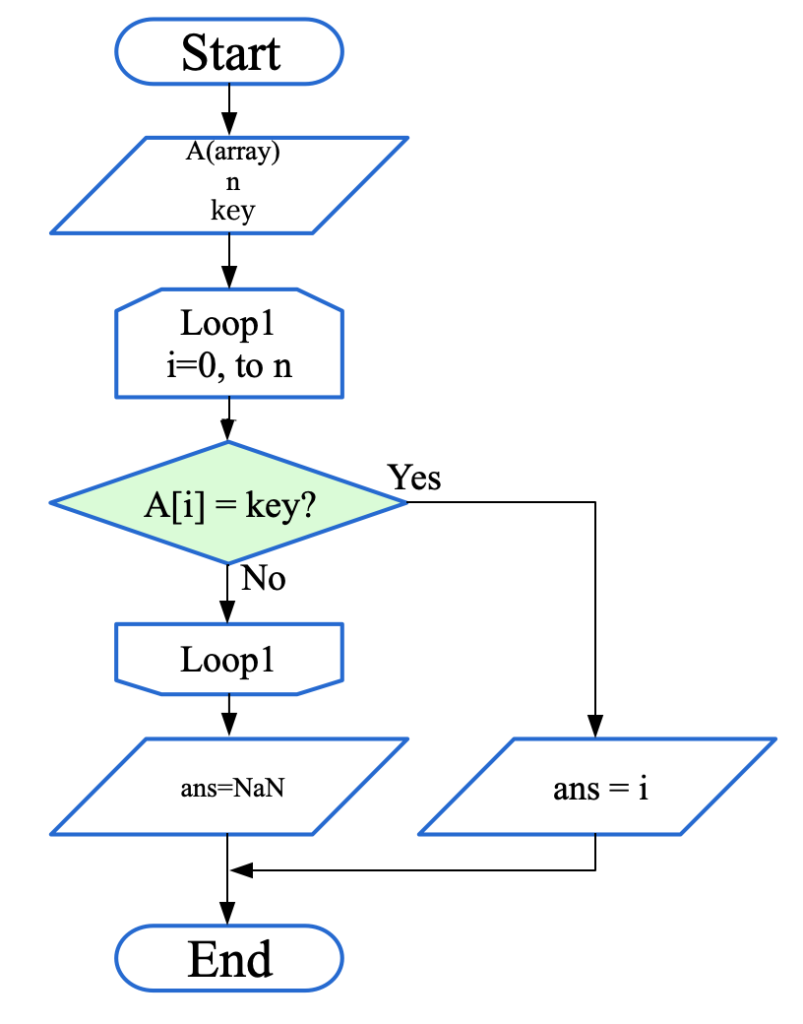
プログラムを書き始める前に、フローチャートで探索アルゴリズムの流れを見ていきましょう。まずは以下に線形探索のフローチャートを示します。
データAを配列として定義し、keyで探索する数値を指定します。線形探索は単純にデータAの中身を順番に取り出し、keyと比較していくという流れなので大変簡単ですね。
ちなみに、このフローチャートでは探索してもkeyが見つからない場合はNaN(Not a Number)を返す仕様です。
線形探索の処理の様子を1コマずつアニメーションで見ていくと以下のGIF動画のようになります。青いソートされたデータの中に赤いターゲットanswerが一つあり、小さい値から順番にサーチしている様子が一目瞭然です。
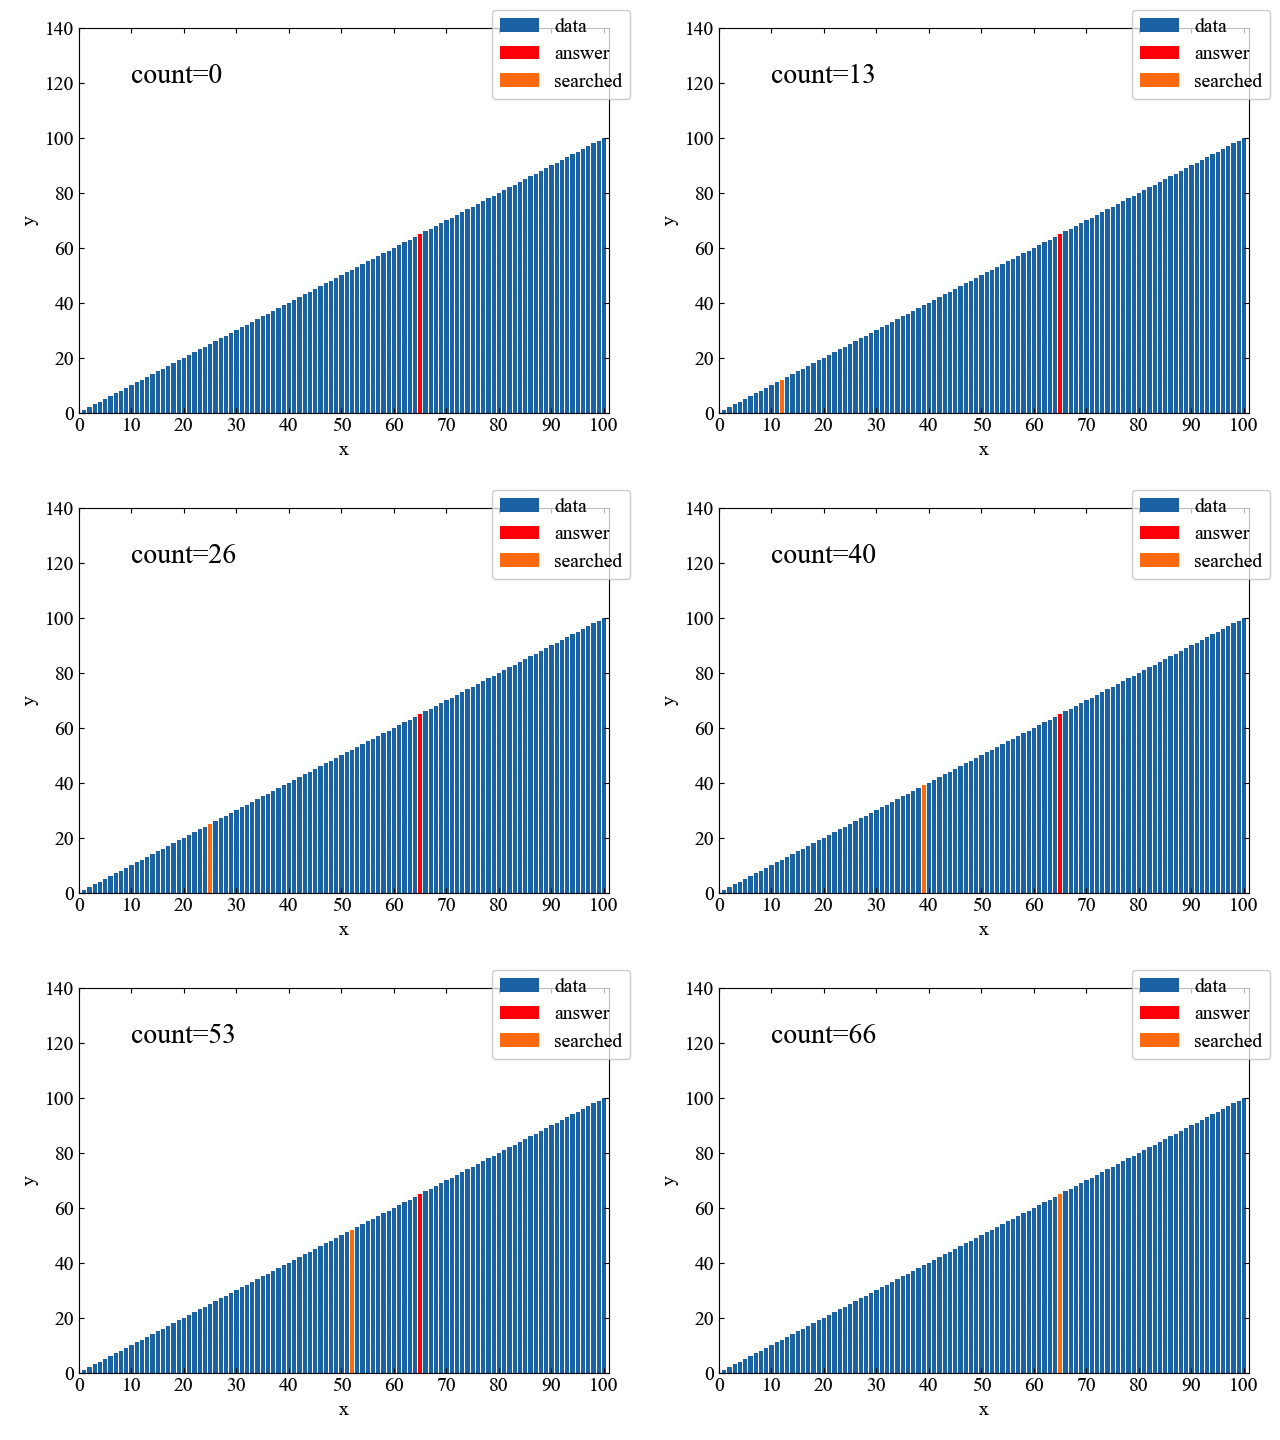
アルゴリズムは大変シンプルでわかりやすいのですが、少しじれったさがありますね。
二分探索
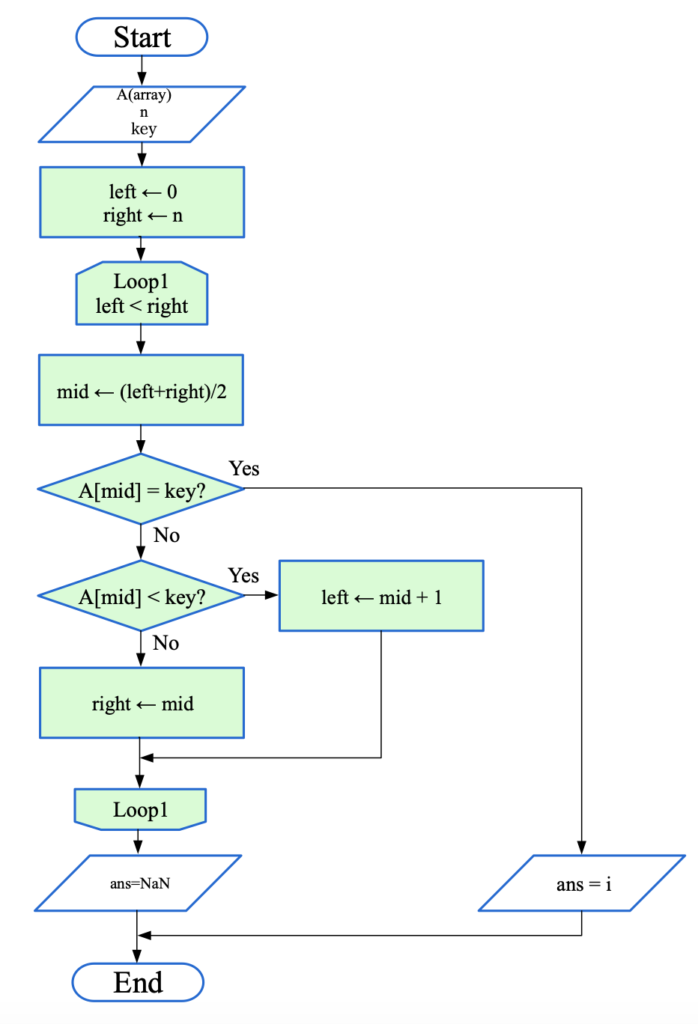
続いて二分探索のフローチャートを以下に示します。上の線形探索と比べるとやや複雑に見えますが、臆せず見ていきましょう。
まず、leftとrightという変数を用意し、「left < right」という条件が満たされている間ループを回します。
leftとrightの中間位置をmidという変数に格納し、data[mid]がkeyでない場合は各変数の大小関係によってleftとrightを書き換えます。
上記フローチャートの処理を1コマずつ見てみると、以下のGIF動画のようになります。「二分」という名の通り、データを半分ずつサーチし、目的の位置に迫っていく様子が一目瞭然です。
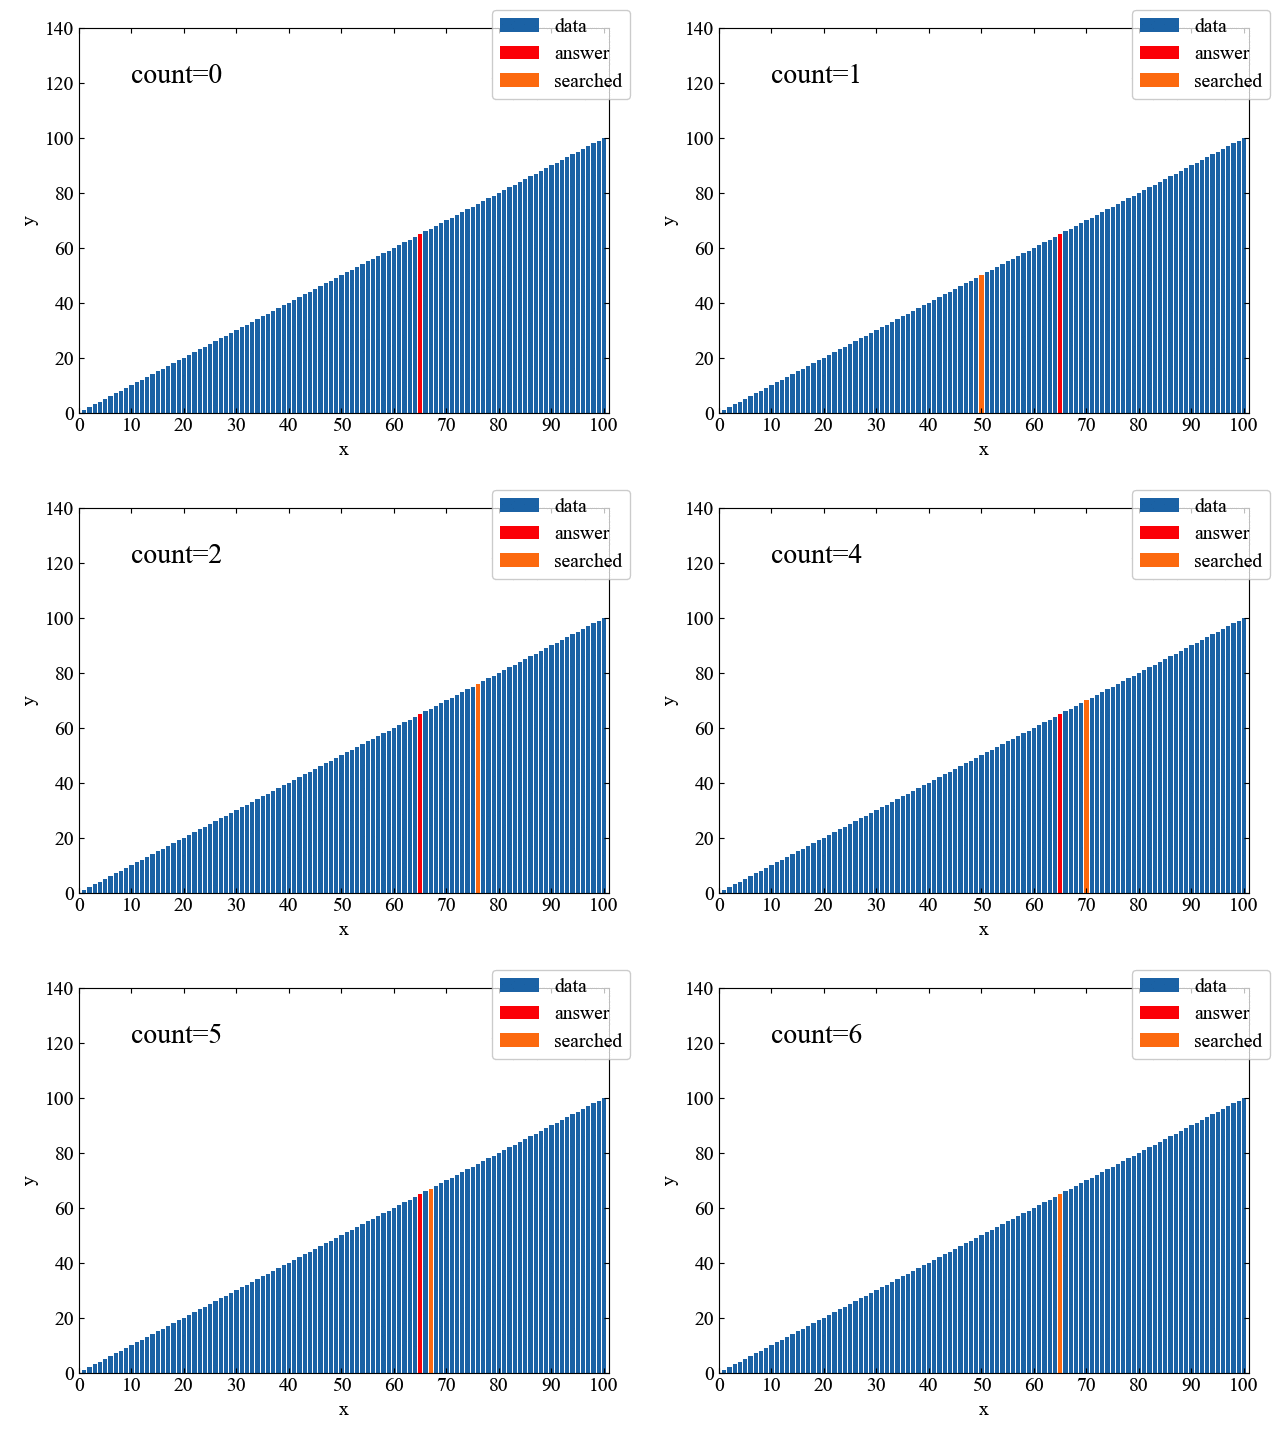
線形探索が66回の計算で正解に辿り着いたのに対し、二分探査はわずか6回の計算で達成しています。
頭良い!
Pythonコード
それでは遅くなりましたが、線形探索と二分探索の両アルゴリズムをPythonコードで書いていきましょう。
線形探索のコード
まずは線形探索のPythonコードです。ここではdef関数形式で記述しています。フローチャートのシンプルさをそのままなのでこちらは簡単でしょう。
|
1 2 3 4 5 6 |
# 線形探索の関数 def linear_search(data, n, key): for i in range(n): if data[i] == key: return i return np.nan |
二分探索のコード
続いて二分探索のPythonコードを以下に示します。
フローチャートそのままですが、ループにwhileを使っているところ、if, elif, elseを使って条件分岐をしているところが特徴です。
|
1 2 3 4 5 6 7 8 9 10 11 12 13 |
# 二分探索の関数 def binary_search(data, n, key): left = 0 right = n while left < right: mid = int((left + right) / 2) if data[mid] == key: return mid elif data[mid] < key: left = mid + 1 else: right = mid return np.nan |
処理回数とオーダー
線形探索のオーダー
探索アルゴリズムは目的の値が見つかれば終了なので、明確な処理回数は決まっていませんが、線形探索は最大でN回ループが回ります(データ準備に行うソート分は含みません)。
そのため線形探索のオーダーは\(O(N)\)と表現します。
二分探索のオーダー
二分探索はN個の要素数を1になるまで2で割っていくことができる最大数が最悪処理回数になります。
そのためオーダーは\(O(\log_{2} N)\)と書きますが、O記法では底は無視しておおざっぱに書くらしいので、\(O(\log N)\)となります。
線形探索と二分探索の比較コード
検証用コードで処理速度を確認
以下のコードは線形探索と二分探索の処理時間を比較するコードです。
時間の差がわかりやすくなるように100万要素作っています。
|
1 2 3 4 5 6 7 8 9 10 11 12 13 14 15 16 17 18 19 20 21 22 23 24 25 26 27 28 29 30 31 32 33 34 35 36 37 38 |
import numpy as np import time # 線形探索の関数 def linear_search(data, n, key): for i in range(n): if data[i] == key: return i return np.nan # 二分探索の関数 def binary_search(data, n, key): left = 0 right = n while left < right: mid = int((left + right) / 2) if data[mid] == key: return mid elif data[mid] < key: left = mid + 1 else: right = mid return np.nan y = np.arange(0, 1000000, 1) key = 650000 # 線形探索を実行して処理時間を表示する t0 = time.time() index = linear_search(y, len(y), key) t_lin = time.time() - t0 print('position=' + str(index), 'time=' + str(t_lin) + '[s]') # 二分探索を実行して処理時間を表示する t0 = time.time() index = binary_search(y, len(y), key) t_bin = time.time() - t0 print('position=' + str(index), 'time=' + str(t_bin) + '[s]') |
以下が実行結果です。目的のkeyを発見するのに線形探索では0.2[s]もかかっているのに対し、二分探索は\(2.4 \times 10^{-5}\)[s]と非常に短い時間でした。アルゴリズムの効果はテキメンです。
|
1 2 |
position=650000 time=0.2078869342803955[s] position=650000 time=2.4080276489257812e-05[s] |
おまけ:アニメーション作成用コード
本記事に説明で使っていたアニメーションはもちろんPythonで画像を作っています。コードの効率は全く考えていない内容ですが、メモ程度に残しておきます(主に自分用)。
アルゴリズムの学習は可視化をすると理解が深まるので是非遊んでみて下さい。
線形探索
|
1 2 3 4 5 6 7 8 9 10 11 12 13 14 15 16 17 18 19 20 21 22 23 24 25 26 27 28 29 30 31 32 33 34 35 36 37 38 39 40 41 42 43 44 45 46 47 48 49 50 51 52 53 54 55 56 57 58 59 60 61 62 63 64 65 66 67 68 69 70 71 72 73 74 75 76 77 78 79 80 81 82 83 84 85 86 |
import numpy as np from matplotlib import pyplot as plt def linear_search(data, n, key): count = 0 axis = np.arange(0, 101, 1) # ここからグラフ描画 # フォントの種類とサイズを設定する。 plt.rcParams['font.size'] = 14 plt.rcParams['font.family'] = 'Times New Roman' # 目盛を内側にする。 plt.rcParams['xtick.direction'] = 'in' plt.rcParams['ytick.direction'] = 'in' # グラフの上下左右に目盛線を付ける。 fig = plt.figure() ax1 = fig.add_subplot(111) ax1.yaxis.set_ticks_position('both') ax1.xaxis.set_ticks_position('both') # 軸のラベルを設定する。 ax1.set_xlabel('x') ax1.set_ylabel('y') ax1.set_xticks(np.arange(0, 101, 10)) ax1.set_xlim(0, 101) ax1.set_ylim(0, 140) # データプロットの準備。 ax1.bar(axis, data, label='data') ax1.bar(key, data[key], label='answer', color='red') ax1.bar(0, 0, label='searched') plt.text(10, 120, 'count=' + str(count), fontsize=20) # グラフを表示する。 fig.tight_layout() fig.legend() plt.savefig('fig_' + str("{:05}".format(count)) + '.png') plt.close() for i in range(n): count += 1 # ここからグラフ描画 # フォントの種類とサイズを設定する。 plt.rcParams['font.size'] = 14 plt.rcParams['font.family'] = 'Times New Roman' # 目盛を内側にする。 plt.rcParams['xtick.direction'] = 'in' plt.rcParams['ytick.direction'] = 'in' # グラフの上下左右に目盛線を付ける。 fig = plt.figure() ax1 = fig.add_subplot(111) ax1.yaxis.set_ticks_position('both') ax1.xaxis.set_ticks_position('both') # 軸のラベルを設定する。 ax1.set_xlabel('x') ax1.set_ylabel('y') ax1.set_xticks(np.arange(0, 101, 10)) ax1.set_xlim(0, 101) ax1.set_ylim(0, 140) # データプロットの準備。 ax1.bar(axis, data, label='data') ax1.bar(key, data[key], label='answer', color='red') ax1.bar(i, data[i], label='searched') plt.text(10, 120, 'count=' + str(count), fontsize=20) # グラフを表示する。 fig.tight_layout() fig.legend() plt.savefig('fig_' + str("{:05}".format(count)) + '.png') plt.close() if data[i] == key: return i return np.nan y = np.arange(0, 101, 1) print(y) index = linear_search(y, len(y), key=65) print(index) |
二分探索
|
1 2 3 4 5 6 7 8 9 10 11 12 13 14 15 16 17 18 19 20 21 22 23 24 25 26 27 28 29 30 31 32 33 34 35 36 37 38 39 40 41 42 43 44 45 46 47 48 49 50 51 52 53 54 55 56 57 58 59 60 61 62 63 64 65 66 67 68 69 70 71 72 73 74 75 76 77 78 79 80 81 82 83 84 85 86 87 88 89 90 91 92 93 94 95 96 97 98 99 100 101 102 103 104 105 106 107 108 109 110 111 112 113 114 115 116 117 118 119 120 121 122 123 124 125 126 127 128 129 130 131 132 133 134 135 136 137 138 139 140 141 142 143 144 145 146 147 148 149 150 151 152 153 154 155 156 157 |
import numpy as np from matplotlib import pyplot as plt def binary_search(data, n, key): count = 0 axis = np.arange(0, 101, 1) # ここからグラフ描画 # フォントの種類とサイズを設定する。 plt.rcParams['font.size'] = 14 plt.rcParams['font.family'] = 'Times New Roman' # 目盛を内側にする。 plt.rcParams['xtick.direction'] = 'in' plt.rcParams['ytick.direction'] = 'in' # グラフの上下左右に目盛線を付ける。 fig = plt.figure() ax1 = fig.add_subplot(111) ax1.yaxis.set_ticks_position('both') ax1.xaxis.set_ticks_position('both') # 軸のラベルを設定する。 ax1.set_xlabel('x') ax1.set_ylabel('y') ax1.set_xticks(np.arange(0, 101, 10)) ax1.set_xlim(0, 101) ax1.set_ylim(0, 140) # データプロットの準備。 ax1.bar(axis, data, label='data') ax1.bar(key, data[key], label='answer', color='red') ax1.bar(0, 0, label='searched') plt.text(10, 120, 'count=' + str(count), fontsize=20) # グラフを表示する。 fig.tight_layout() fig.legend() plt.savefig('fig_' + str("{:05}".format(count)) + '.png') plt.close() left = 0 right = n while left < right: count += 1 mid = int((left + right) / 2) if data[mid] == key: # ここからグラフ描画 # フォントの種類とサイズを設定する。 plt.rcParams['font.size'] = 14 plt.rcParams['font.family'] = 'Times New Roman' # 目盛を内側にする。 plt.rcParams['xtick.direction'] = 'in' plt.rcParams['ytick.direction'] = 'in' # グラフの上下左右に目盛線を付ける。 fig = plt.figure() ax1 = fig.add_subplot(111) ax1.yaxis.set_ticks_position('both') ax1.xaxis.set_ticks_position('both') # 軸のラベルを設定する。 ax1.set_xlabel('x') ax1.set_ylabel('y') ax1.set_xticks(np.arange(0, 101, 10)) ax1.set_xlim(0, 101) ax1.set_ylim(0, 140) # データプロットの準備。 ax1.bar(axis, data, label='data') ax1.bar(key, data[key], label='answer', color='red') ax1.bar(mid, data[mid], label='searched') plt.text(10, 120, 'count=' + str(count), fontsize=20) # グラフを表示する。 fig.tight_layout() fig.legend() plt.savefig('fig_' + str("{:05}".format(count)) + '.png') plt.close() return mid elif data[mid] < key: # ここからグラフ描画 # フォントの種類とサイズを設定する。 plt.rcParams['font.size'] = 14 plt.rcParams['font.family'] = 'Times New Roman' # 目盛を内側にする。 plt.rcParams['xtick.direction'] = 'in' plt.rcParams['ytick.direction'] = 'in' # グラフの上下左右に目盛線を付ける。 fig = plt.figure() ax1 = fig.add_subplot(111) ax1.yaxis.set_ticks_position('both') ax1.xaxis.set_ticks_position('both') # 軸のラベルを設定する。 ax1.set_xlabel('x') ax1.set_ylabel('y') ax1.set_xticks(np.arange(0, 101, 10)) ax1.set_xlim(0, 101) ax1.set_ylim(0, 140) # データプロットの準備。 ax1.bar(axis, data, label='data') ax1.bar(key, data[key], label='answer', color='red') ax1.bar(mid, data[mid], label='searched') plt.text(10, 120, 'count=' + str(count), fontsize=20) # グラフを表示する。 fig.tight_layout() fig.legend() plt.savefig('fig_' + str("{:05}".format(count)) + '.png') plt.close() left = mid + 1 else: # ここからグラフ描画 # フォントの種類とサイズを設定する。 plt.rcParams['font.size'] = 14 plt.rcParams['font.family'] = 'Times New Roman' # 目盛を内側にする。 plt.rcParams['xtick.direction'] = 'in' plt.rcParams['ytick.direction'] = 'in' # グラフの上下左右に目盛線を付ける。 fig = plt.figure() ax1 = fig.add_subplot(111) ax1.yaxis.set_ticks_position('both') ax1.xaxis.set_ticks_position('both') # 軸のラベルを設定する。 ax1.set_xlabel('x') ax1.set_ylabel('y') ax1.set_xticks(np.arange(0, 101, 10)) ax1.set_xlim(0, 101) ax1.set_ylim(0, 140) # データプロットの準備。 ax1.bar(axis, data, label='data') ax1.bar(key, data[key], label='answer', color='red') ax1.bar(mid, data[mid], label='searched') plt.text(10, 120, 'count=' + str(count), fontsize=20) # グラフを表示する。 fig.tight_layout() fig.legend() plt.savefig('fig_' + str("{:05}".format(count)) + '.png') plt.close() right = mid return np.nan y = np.arange(0, 101, 1) print(y) index = binary_search(y, len(y), key=65) print(index) |
まとめ
本記事では探索アルゴリズムとして線形探索と二分探索の概要を紹介し、フローチャート、図解アニメーション、Python関数による表現、処理時間の検証を行いました。
\(O(\log N)\)オーダーの二分探索は大変強力な探索アルゴリズムであることが確認できました。
アルゴリズムの違いでこんなに処理時間が変わるのは驚きです!
Twitterでも関連情報をつぶやいているので、wat(@watlablog)のフォローお待ちしています!

 ついにWATLABブログから書籍「いきなりプログラミングPython」が発売しました!